

Primer on Cap Tables
In the world of venture-track high-growth companies, cap tables are a big part of life.
Cap tables can get super complicated though and the math behind them is not easy to understand. We’ve put this Primer together to summarize language used in cap tables, provide some direction on building your cap table, and to answer the questions we receive most frequently.
This is not a “quick read”. If you want to get the most out of this, it will require blocking the time to slowly go through it step by step. Cap table math is not simple unfortunately. So even with our best efforts, this is still going to feel dense.
While we hope this is a helpful tool to empower entrepreneurs, work with your lawyer to get your cap table dialed in if you’re unsure about anything. Lawyers in the world of venture capital and venture-track high-growth companies should all understand this stuff pretty well.
WHAT IS A CAP TABLE?
A cap table (short for “capitalization table”) is a summary of all shares that are issued and outstanding in a company. It is a snap shot into a company’s ownership.
The summary is in table form, typically generated and tracked in a spreadsheet.
SPREADSHEETS?! HAVEN’T YOU HEARD OF CAP TABLE SOFTWARE?
We know that there are a ton (overwhelmingly so) of online tools and applications out there to help build cap tables.
We encourage entrepreneurs to build their cap table in a spreadsheet though.
Here are a few reasons why:
We think it’s important that entrepreneurs understand the mechanics and math behind their cap table. The better you understand your cap table, the better you can negotiate financings and plan for the future. The spreadsheet forces you to really think through what’s happening in your company and what the implications of your decisions are. It gets you under the hood. And that’s a powerful place to be.
Software tools are as good as the person entering the data. If you don’t enter the right data, the tool can’t spit out the right data. We often receive cap tables generated by these tools. There are often errors in them because of incorrect data entry. Then guess what? We need to correct it by building a new cap table from scratch in a spreadsheet.
Like it or not, spreadsheets remain the standard when negotiating financings between legal teams. Spreadsheets get circulated, the math behind the numbers gets reviewed and audited, and revisions get circulated. You want to be able to track what’s happening to the numbers through this process, and that requires understanding the spreadsheets.
We’re not against the software! But as an entrepreneur, you should understand your cap table. To do that, we think it’s most helpful to build one yourself. Once you’ve got that mastered, use the software to your hearts content if it helps. But figure it out before you do.
WHAT IS A “FULLY-DILUTED” CAP TABLE?
While a cap table shows all of the issued and outstanding shares in the company, a “fully-diluted” cap table takes things a step further. A “fully-diluted” cap table additionally includes all of the issued and outstanding securities that are convertible or exchangeable into shares in the Company, such as stock options, convertible notes, and SAFEs.
Since these additional securities have rights to shares in the future (conditional as those rights may be), this version of the cap table gives a better view of ownership by assuming the fulfillment of those conditions and the full conversion and exchange of those rights to shares. These additional securities have all been authorized or promised by the company after all, so it’s helpful to know what the ownership looks like if all those authorizations and promises get realized.
If an investor asks you for a cap table, they are likely referring to a “fully-diluted” cap table. And when the share price is determined for a financing using a pre-money valuation, it is calculated by dividing that pre-money valuation by the “fully-diluted” capitalization of the Company. So this version of the cap table is most important and what we’ll focus on in this primer.
With that said, if you are simply trying to determine voting power in the Company for the sake of a shareholders’ meeting or approval, it is not the fully-diluted cap table you look at, but the simpler cap table that shows actual ownership of shares on the date of calculation. After all, voting power is exclusively held by shareholders, so the additional securities would not be counted.
WHAT IS A PRO-FORMA CAP TABLE?
A “pro forma” cap table takes it the final distance by showing both the present ownership and also the projecting future ownership after the occurrence of certain anticipated events, like a financing.
A simple “pro forma” cap table will show the cap table “pre-money” and “post-money”. But “pro forma” cap tables can get exceedingly more complex by projecting multiple successive events that affect ownership (ex: Series Seed financing, Series A financing, and Series B financing).
WHAT IS MEANT BY “PRE-MONEY” AND “POST-MONEY”?
Pre-money refers to the point in time immediately prior to an investment being made into the company.
Post-money refers to the point in time immediately after an investment being made into the company.
Pretty intuitive right?
We see these two terms used in different financing contexts. It is important to understand the context these terms are used in to be sure of their meaning. Unfortunately, it’s not always that intuitive.
On the intuitive side, we see the terms used as “Pre-Money Valuation” and “Post-Money Valuation”. Pre-money valuation is the company’s valuation immediately prior to an investment being made into the company; and Post-money valuation is the company’s valuation immediately after an investment being made into the company. Calculating the post-money valuation is super easy: It’s simply the sum of the pre-money valuation and the amount of new money raised by the company.
On the less intuitive side, we see “Post-Money” used in the context of a Post-Money SAFE. This is misleading. The Post-Money SAFE converts immediately prior to the triggering investment being made into the company, not after. We’ll get into this more, but the point is, context matters. Pay attention to the context used with the term.
HOW DO I BUILD A CAP TABLE?
Here’s how you can build a basic “fully-diluted” cap table on your own in a spreadsheet (get your spreadsheet open!):
1. SHARES
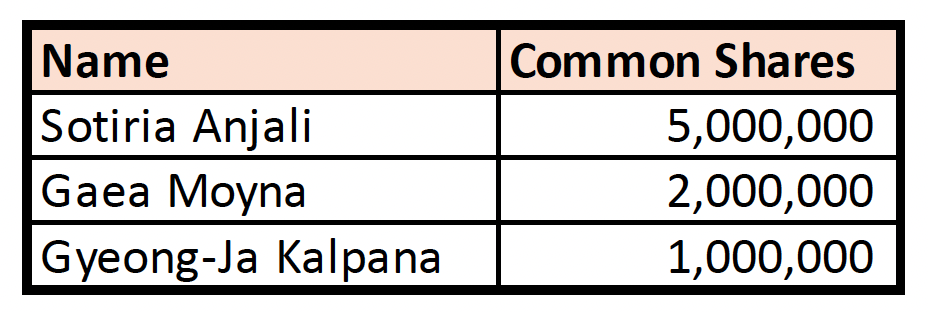
First, list all the shares issued and outstanding in the company. This is the simplest step: just grab your securities register and copy the official shareholder names and the official share numbers held by each shareholder.
If there are different classes of shares held by a shareholder, those shares should be split out. For example, if Jane Tall has 1,000,000 Common shares and 250,000 Preferred shares, those should be separately listed, as those shares likely hold different rights and each class will be treated differently as your cap table evolves over time.
2. OPTIONS
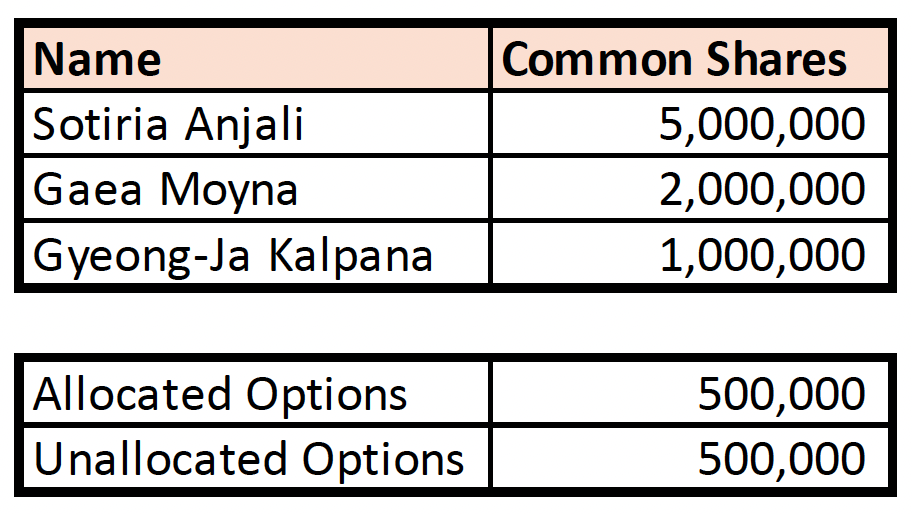
Next, list all the stock options of the company. There are two primary categories to consider for stock options: (a) allocated stock options; and (b) unallocated stock options.
Allocated stock options are those that have already been granted under stock option agreements, whether or not they’ve vested. List the total number of shares allocated under these allocated stock options. Instead of listing each optionee and option allocation, this can be a single lump-sum entry. Keep in mind, any stock options that have already been exercised into shares are not included here, as they would otherwise be duplicated since they already be counted in the list of shareholders above. Simply pull together all the stock option agreements and add up the number of shares allocated under the options granted.
Unallocated stock options are those that have been reserved by resolution of the company’s board of directors, but not yet granted to anyone. Typically a company will hold its reserved but unallocated stock options in a stock option pool that’s been set up by the company’s board of directors. If you have that, simply take that number and subtract the allocated options from under that pool in order to determine the unallocated stock options.
Quick note – “stock option” references above can include restricted stock units, incentive stock options, and other forms of equity incentive. We are referencing them all as “stock options” here to keep things simple.
3. OTHER CONVERTIBLE SECURITIES
If the company has issued any other security that has rights to convert or exchange into shares in the company (such as Convertible Notes or SAFEs), those should be summarized also, though not in the same way.
These securities can’t yet show up on the cap table in the same way because we don’t yet know how many shares they are going to be entitled to. Convertible securities convert or exchange into shares on the basis of a valuation determined at a future event. So until we have that valuation, we would not reflect those convertibles in a unit of shares but instead in the unit of their monetary investment amount.
While you could include the share count of certain convertible securities using its valuation cap (if there is one), we typically do not reflect the conversion until we are building a “pro forma” cap table.
At this stage, we would just list the investor names and their investment amounts, categorized by their type of convertible security.
CALCULATING OWNERSHIP PERCENTAGE ON “FULLY-DILUTED” BASIS
To determine ownership percentage on a “full-diluted basis”, you must first determine the company’s “fully-diluted” capitalization. This is the sum of all shares and stock options.
After you’ve determined this, simply divide each entry on the cap table by that total capitalization to get the ownership percentage.
HOW DO I DETERMINE THE SHARE PRICE FOR MY NEXT FINANCING?
It’s quite simple: just divide your pre-money valuation by the total “fully-diluted” capitalization calculated immediately prior to the financing on a fully-diluted basis.
That will be the price per share new investors will purchase at.
For example, if the company has a pre-money valuation of $22,500,000, and has a total fully-diluted capitalization of 11,250,000 immediately prior to the financing, then the price per share for the financing will be: $2.00.
Note that this math is not super simple if you have Post-Money Safes in play prior to doing a financing, as those need to first be converted before you can calculate the share price. More on that in the Post-Money Safe section below.
A couple things to think about with this:
Watch for Rounding on the Share Price. If your spreadsheet is set to automatically round the number up to the nearest tenth, you’re going to get rounding errors in your calculations. It’s helpful to show many digits so you can catch those. For example, if you if the company has a pre-money valuation of $2,500,000, and has a total fully-diluted capitalization of 11,055,000 immediately prior to the financing, then the price per share for the financing will be: $0.226142017186793. If that got rounded automatically to $0.23, then the math will shake out very different numbers when applied to the new money invested. In this case, if $1,000,000 was being invested at these share prices, the difference between the full share price and the rounded share price is 74,173 shares. Using the full share price is more precise.
How to Clean up your Share Price. Of course, a 15 digit share price looks weird. If you’d like a clean share price, what we would do is round it to the $0.23, then recalculate the pre-money valuation to match that. In this case, that means multiplying $0.23 (the new share price) by the total pre-money capitalization of 11,055,000, which gives us an updated pre-money valuation of $2,542,650. It’s not as clean as the $2.5M number, but it’s certainly cleaner than a 15 digit share price. And the reality is, the pre-money valuation only gets used to calculate the share price, but doesn’t show up on the legal documents (just the term sheet). After the share price is determined, that is what shows up on all the legal documents (the share purchase agreement, the securities register, the share certificate, and the share terms). So we would advocate for this method.
HOW DO I BUILD A PRO-FORMA CAP TABLE?
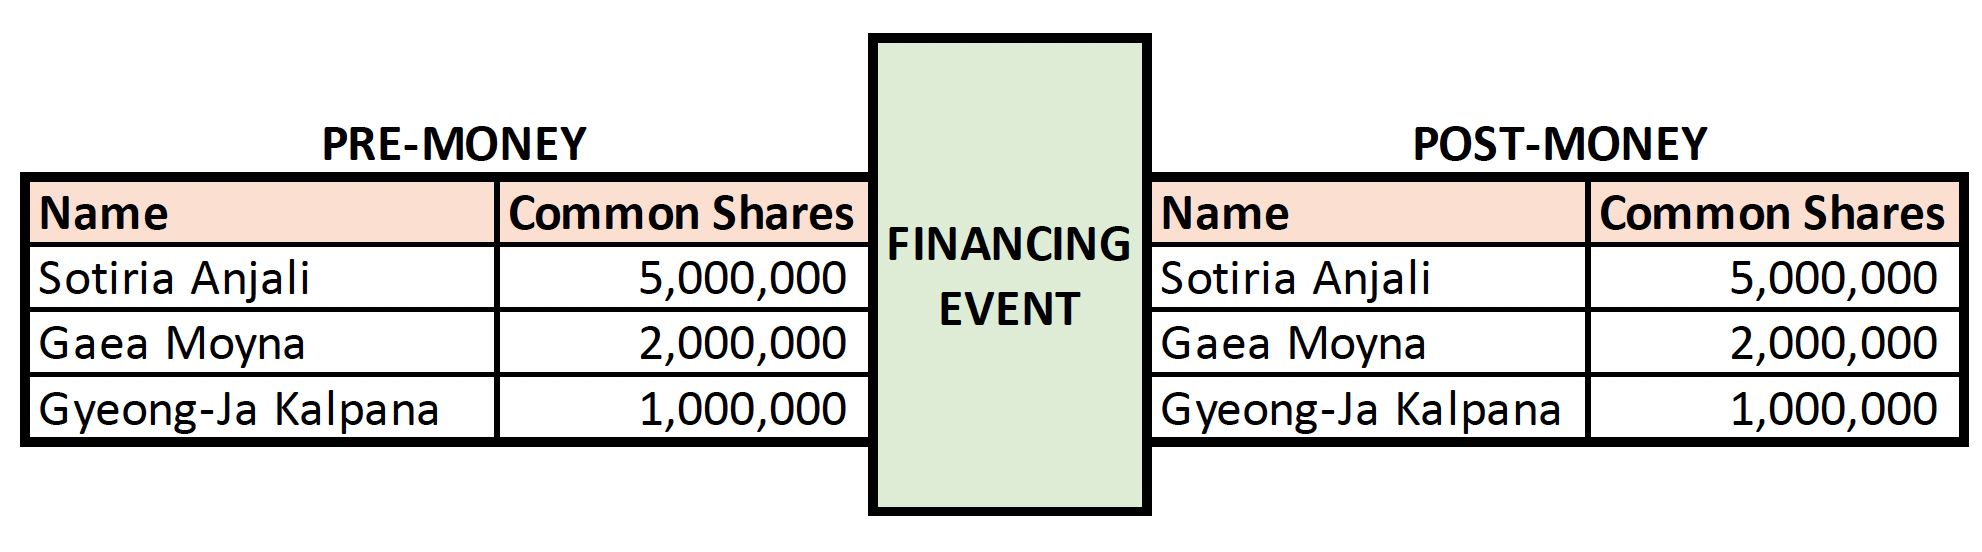
As we learned above, a “pro-forma” cap table is one that shows current and projected ownership of the Company. A simple “pro-forma” cap table will show the pre-money cap table and the post-money cap table (which is what the ownership summary will look like immediately after the next financing).
Here’s how we set up the post-money cap table:
1. EXISTING SHARES
The existing shareholders will have the same number of shares before and after the next financing, unless the shareholder buys more shares as part of the financing (pursuant to a pro-rata right for example) or sell some of their shares as part of the financing (pursuant to a “secondary sale” for example). Assuming there’s no shares purchased or sold by existing shareholders, this step is the easy one. Simply put the same number of shares post-money as the shareholder had pre-money.
2. NEW MONEY
The new investors (i.e. “new money”) are buying new shares from treasury at the share price we’ve determined above. There’s a common misunderstanding that investors are buying existing shares instead of new shares - more on this at this LINK. To determine how many shares they’ll be issued, and therefore how many shares to specify on the post-money cap table, simply divide their investment amount by the share price. Round down if you get any fractional shares in that calculation, as each share must be fully paid for. So, if the share price is $0.23 and $1,000,000 is invested, the total number of shares would be 4,347,826.
3. OPTIONS
It may be that the total number of allocated stock options and unallocated stock options is the same immediately before and immediately after the financing. If that’s the case, these numbers will be the same on both sides of the cap table. However, often the stock option plan pool size will be increased with a new financing, which is called an “Option Refresh”. This means the number of unallocated stock options will be different post-money.
Calculating the post-money option pool size (the unallocated stock options) can happen using two different methods: (1) Pre-Money Option Pool Method or (2) Post-Money Option Pool Method. The naming is confusing here, but it essentially refers to whether the Option Pool dilutes the pre-money shareholders or the post-money shareholders.
(A) Post-Money Option Pool Method means that new Option Pool size is put in place at the same time as, or immediately after, the investment happening (i.e. “Post-Money”). In other words, the increase doesn’t happen until after the new money is in, which means the new investors get diluted with everyone else. This is Founder Friendly because it spreads the impact of the increased pool size across more shareholders. Calculating the Option Pool using this method is super easy on the Pro-Forma Cap Table. You simply add a 10% pool after the Company’s capitalization is determined, and it dilutes everyone.
(B) Pre-Money Option Pool Method means that new Option Pool size is put in place before the investment happens (i.e. “Pre-Money”). In other words, we calculate what size of Option Pool we would need to amount to the target percent post-money, then put it in place pre-money, so that all the dilution is done before the new investors come in. This is Investor Friendly, because all the dilution happens to the shareholders that exist immediately prior to their coming in. By the time the new investors put money in, the new Option Pool size has already been put in place, so they are not diluted by it. Standard VC financing term sheets unsurprisingly use this approach.
But wait – if we are required to have a 10% Option Pool post-money, but have to dilute those shares pre-money, doesn’t that create circular math? We don’t know how many shares there will be post-money without first knowing pre-money right? Seems confusing.
To calculate this (assuming convertibles have converted in immediately before – which we’ll cover in the next step):
Determine the New Money % for new investors ( = Amount Raised / Post-Money Valuation).
Determine the Option Refresh % (i.e. the Option Pool Size required immediately after the investment. This will come straight from the term sheet).
Post-Money Capitalization = (Fully-Diluted Pre-Money Capitalization) / (1 – (New Money % + Option Refresh %))
Option Refresh Amount = Post-Money Capitalization * Option Refresh %
Now with that Option Refresh Amount known, we put it in place immediately prior to the financing so that it only dilutes existing shareholders, and not new investors.
4. CONVERTIBLES
Assuming that the financing we’re working through on this cap table is the kind that triggers a conversion of the convertible securities, it’s now time to think about how these end up on the cap table.
Each type of convertible security has its own unique conversion features, and to complicate matters, often people customize individual convertible securities with unique terms. We need to understand the type of convertible security we’re dealing with and the implications of any unique terms under any individual convertible security in order to properly account for them on our cap table.
This primer will simply speak to the most standard convertible securities and their conversion features. You need to get your lawyer involved to see if there’s anything unique in yours to account for.
(A) CONVERTIBLE NOTE
To calculate the number of shares a Convertible Note holder is entitled to, we need to know a few of the variables applicable to the Convertible Note itself, including (1) the principal amount (i.e. the amount invested under the Convertible Note); (2) the interest rate, and whether interest is included in the conversion calculation (some Convertible Notes only convert the principal amount and some convert both the principal amount and the accrued interest up to the date of conversion); (3) the valuation cap, if any; and (4) the discount rate, if any.
If the pre-money valuation of the financing is less than or equal to the valuation cap on the Convertible Note, then the discount rate will apply. Simply apply the discount rate to the financing’s share price then divide the dollar amount being converted (principal or principal plus interest, as applicable) by that share price to determine the number of shares issued on conversion.
If the pre-money valuation of the financing is greater than the valuation cap, then using the valuation cap may result in a greater number of shares to the Convertible Note holder. If that’s the case, determine the applicable share price with the valuation cap (calculated by dividing the valuation cap by the Company’s capitalization immediately prior to the financing) and use that share price to calculate the number of shares issued on conversion.
The Convertible Note holder benefits from the calculation that yields the most shares.
As with any calculation of shares, round down to the nearest share number on all these calculations, as all shares must be fully paid to be issued.
(B) PRE-MONEY SAFE
The older form of Safe (Simple Agreement for Future Equity) used in market was a “pre-money” Safe.
We won’t put as much attention on this, given that Pre-Money Safes are not used as much anymore (replaced now with the Post-Money Safe). We still see them around though, and they’re pretty easy to deal with on your cap table (unlike the Post-Money Safe… thanks YC).
The Pre-Money Safe converts concurrent with the New Money, so it is treated in the same way as the Convertible Notes above.
(C) POST-MONEY SAFE
The standard Safe (Simple Agreement for Future Equity) in market is now a “Post-Money” Safe.
The main difference is that the Post-Money Safe converts immediately prior to the financing, so that the Safes dilute existing shareholders only, and not new investors. Confusing, because it converts Pre-Money technically, but is called a Post-Money Safe (… thanks YC).
How to Understand the Post-Money Safe
Here’s an important timeline to understand if you’re going to wrap your head around the Post-Money Safe:

There are 3 points in time (shown on the timeline above): (1) Pre-Money, which is when the Safes are still outstanding and not converted; (2) Pre-Money+ (that’s what we call it at least), which is still before New Money is in, but is the time when the Post-Money Safes are converted; and (3) Post-Money, which is the time immediately after New Money is in.
The Post-Money Safes get converted in the Pre-Money+ stage, which is immediately before a Preferred share Financing (the New Money). It’s this fictional point in time that’s sandwiched between Pre-Money and Post-Money on a Preferred share Financing so that the Safes only dilute the existing shareholders. This makes the Safe much more Investor Friendly than the prior Safe in market.
Keep in mind then, that this means Safe investors will be immediately diluted by the New Money coming in, because they’ve converted at the Pre-Money+ time. This is why Safe investors might negotiate pro-rata rights, so they can immediately buy some more shares to top-up their position with the New Money.
Important to understand this, because your calculation of financing share price may be complicated if you have Post-Money Safes in play. The total “fully-diluted” capitalization calculated immediately prior to the financing that gets used to determine the financing share price must include the conversion of the Safes. So the more Safes you have the more the financing share price will drop.
Summary Points
Pre-Money Capitalization for the Preferred share Financing = [Pre-Money+ Capitalization] + Safe Shares
Post-Money Valuation Cap on the Safe = Post-Money Valuation of the Pre-Money+.
Post-Money Valuation Cap on the Safe = Pre-Money Valuation of the Preferred share Financing
Converting the Post-Money Safe
To determine the number of shares to issue to a Post-Money Safe holder, you calculate the number of shares that result from the Safe Price Method and also the number of shares that result from the Discount Price Method, then go with the higher amount. The Safe Price Method is only used if there’s a Valuation Cap on the Safe; and the Discount Price Method is only used if there’s a Discount Rate on the Safe.
WARNING! This is where things get complicated (if they’re not already), and where we learn that the “Simple” Agreement for Future Equity is not actually simple at all.
(A) The Safe Price Method
Under this method, the number of shares issued is equal to the Purchase Amount (the amount invested) divided by the Safe Price.
To calculate the Safe Price, you divide the Valuation Cap on the Safe by the Company Capitalization.
The Valuation Cap is easy: just grab that number from the top of the Safe.
The Company Capitalization is where this gets tricky. The Company Capitalization is the sum of the following (without double-counting anything):
Shares: All of the issued and outstanding shares in the Company immediately before the financing.
Granted (Allocated) Options: All of the issued and outstanding options in the Company (vested or unvested).
Promised Options: Any options in the Company that have been promised to people, but not yet granted.
Reserved (Unallocated) Shares for Options: Any shares in the Company that have been reserved but have not been granted or promised to anyone. We do not include the number of shares that will be added to the option pool as part of the financing except to the extent that there are not enough shares reserved to cover the amount of options promised. (Unsolicited Commentary: We think that results in double counting. Despite the Safe saying that we shouldn’t double count, this is required under the formula. We don’t make the rules).
Convertible Securities: This can get confusing. We’re required to figure out how many shares all the Safes will be entitled to, in order to calculate how many shares each Safe will be entitled to 🤯. Seems circular doesn’t it? That’s because it is! The calculations here generally require spreadsheets and heavy iterative math - work with your lawyer, CFO, or cap table software to do this to ensure it’s right.
It’s not enough to just divide the Purchase Amount by the Valuation Cap to get the percentage here. That may yield an “implied percentage” which can give you a ballpark figure to work with, but it won’t give you the precise conversion calculations you need to complete the financing.
(B) The Discount Price Method
Under this method, the number of shares issued is equal to the Purchase Amount (the amount invested) divided by the Discount Price.
The Discount Price is the price per share in the financing, multiplied by the Discount Rate.
This sounds simple enough. But the tricky thing is that we can’t figure out the price per share until we know the company’s capitalization, which requires us to know how many shares each Safe will be entitled to. Back to the circular math 🤯. Again, this generally requires spreadsheets and heavy iterative math - work with your lawyer, CFO, or cap table software to do this to ensure it’s right.
It’s not enough to just apply the Discount Rate to the pre-money valuation or the valuation cap. Those may yield “implied percentages” which can give you a ballpark figure to work with, but they won’t give you the precise conversion calculations you need to complete the financing.
Ink LLP is a business law firm that acts as strategic counsel to ambitious entrepreneurs, investors, and high-growth companies. Contact one of our lawyers to discuss your business and how our team might be able to help you tackle the challenges of your business and the opportunities for growth.
This information is provided for informational purposes only and is not legal advice.